Clarifying data on Sea Level Rise
D H White - 14 Poole Place, Sunshine Bay NSW 2536
N.Lenehan - Eurobodalla Shire Council PO Box 99, Moruya NSW 2537
The National Tidal Centre (NTC) of the Bureau of Meteorology is responsible for monitoring tide gauges around Australia. It publishes its annual report3 on sea level data from 'The Australian Baseline Sea Level Monitoring Project'.
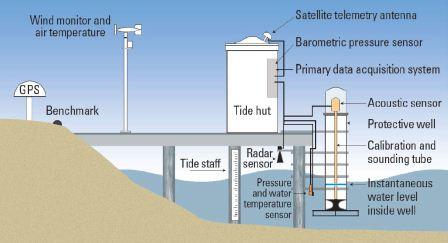
Figure 1- Schematic of SEAFRAME station used by the Australian Baseline Sea Level Monitoring Project3.
Some locals have erroneously concluded that sea level rise on the south coast of NSW is less than 1 mm a year, based on data from the Port Kembla tide gauge. This is a consequence of the wrong data being sourced from the NTC's annual report3.
The trend of sea level relative to the land at Port Kembla is about 3.2 mm a year (Table 2, column 3 of the 2010-11 report), which is what is relevant for local impact studies because it is the actual local sea level rise. It also perchance happens to equal concurrent global sea level rise.
Location | Installation Date | Sea Level Trend (mm/yr) | Change in trend from June 2010 (mm/yr) |
|---|---|---|---|
Port Kembla | Jul 1991 | 3.2 | 0.2 |
Table 2 (Port Kembla only). Recent short-term relative sea level trends based upon SEAFRAME data to June 2011.
If you deduct the component caused by changes in atmospheric pressure at Port Kembla from the observed 3.2 mm a year then you get the net relative sea level trend of 2.6 mm a year (Table 5 of the report). Although this is not the actual sea level rise at Port Kembla, this correction is useful to scientists for determining the magnitude of atmospheric pressure influences across regions and seasons.
Location | Installation Date | Net Relative Sea Level Trend (mm/yr) | Change from June 2010 (mm/yr) |
|---|---|---|---|
Port Kembla | Jul 1991 | 2.6 | 0.5 |
Table 5 (Port Kembla only). The net relative sea level trend estimates to June 2011 after vertical movements in the observing platform relative to a local land benchmark and the inverted barometric pressure effect are taken into account.
The other issue causing confusion is that the rate of sea level rise varies considerably between regions and seasons. Contributing factors are oceanic currents, temperatures and salinity, along with the substantial influence of the El Niño - Southern Oscillation (ENSO) and other climate systems4. Data from tide gauges and satellite altimeters are confirming that the underlying global trend continues to rise as displayed by the CSIRO Marine and Atmospheric Research http://www.cmar.csiro.au/sealevel/ consistent with the worst-case IPCC projections.
References
- National Tidal Centre 2011. The Australian Baseline Sea Level Monitoring Project. Annual sea level data summary report. July 2010 - June 2011.
- Church, J.A. and N.J. White, 2011. Sea-level rise from the late 19th to the early 21st century. Surveys in Geophysics 4/5, 585-602.